SMRs energy output projection
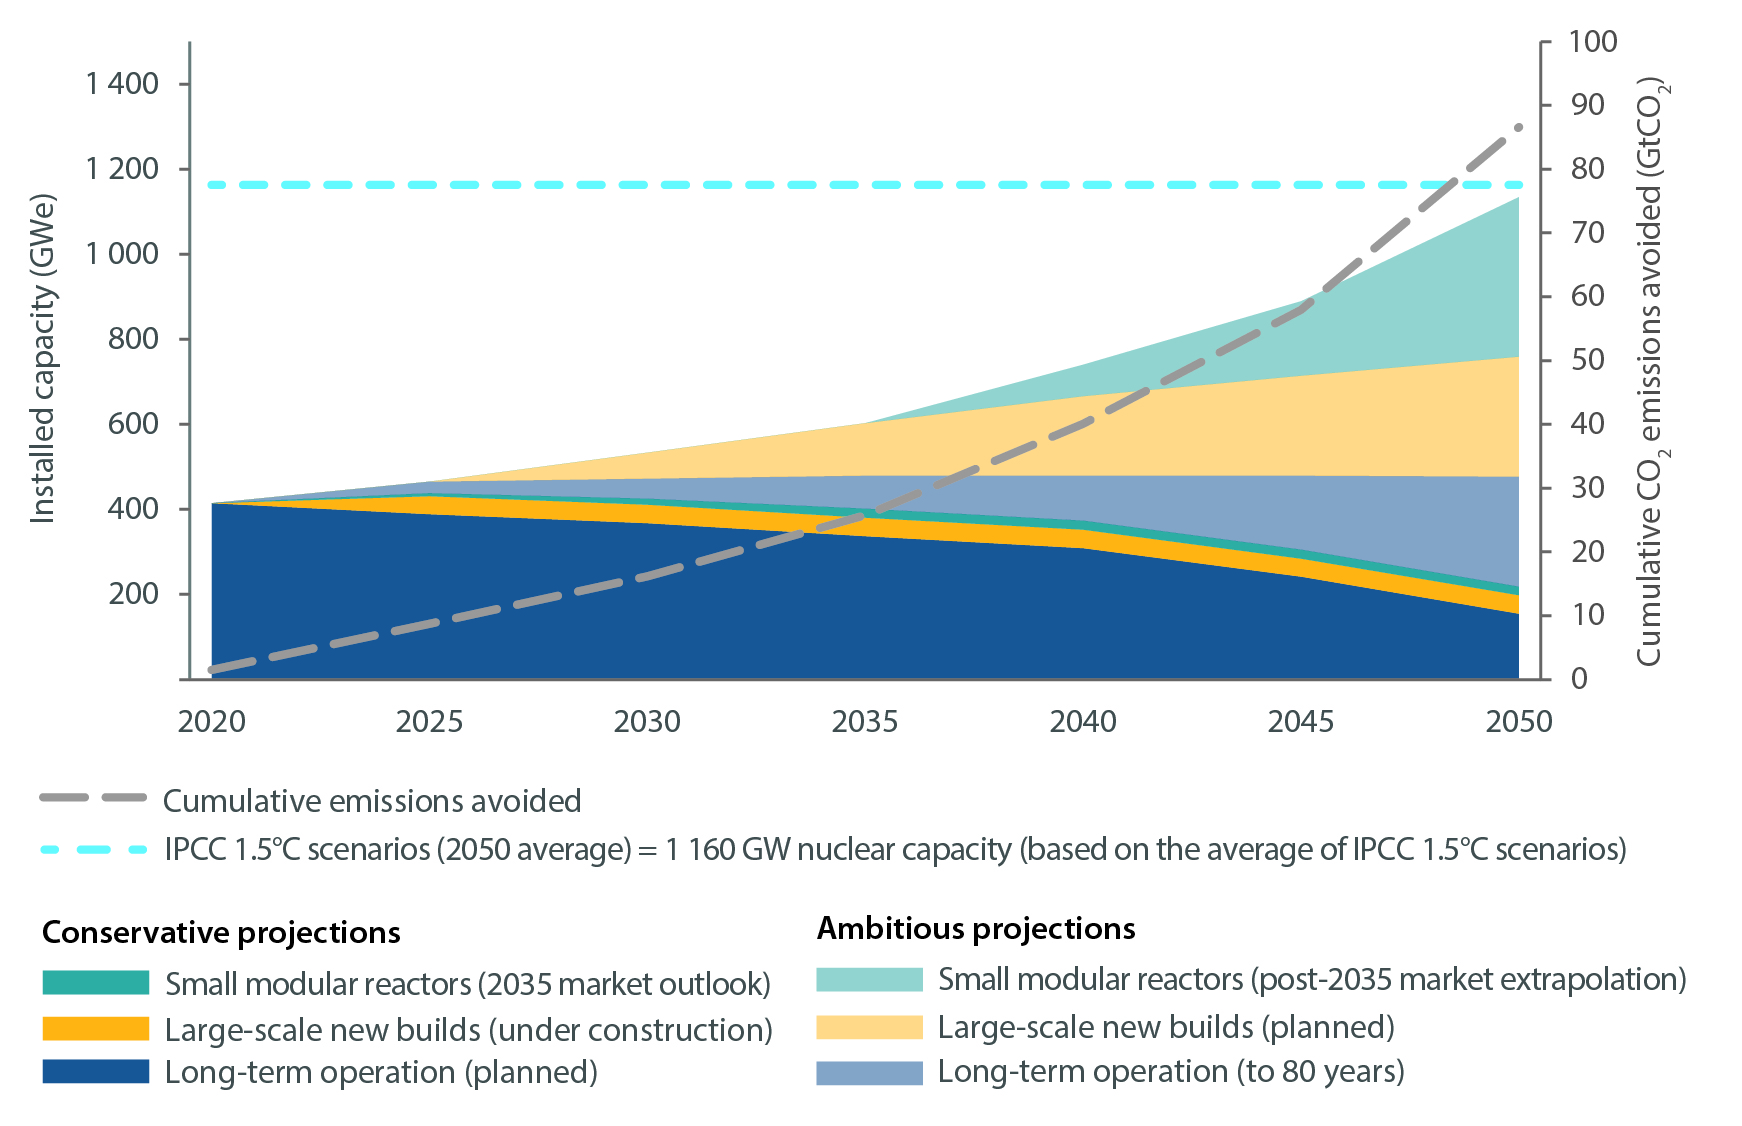
The stacked area graph depicts the projected global installed nuclear capacity (GWe) alongside cumulative CO₂ emissions avoided up to 2050. It compares conservative and ambitious projections of Small Modular Reactors (SMRs) deployment, along with large-scale nuclear builds and long-term operation of existing plants. The dashed horizontal line marks the IPCC's recommended nuclear capacity to meet 1.5°C scenarios. The shaded areas represent the contribution of each energy source type, showing an increasing role for SMRs, particularly in ambitious scenarios. This graph effectively highlights how ambitious SMR deployment can significantly reduce CO₂ emissions while contributing to the energy mix.

